常见的测量CPU loading 的工具有:
- sar
- top
- iostat
- mpstat
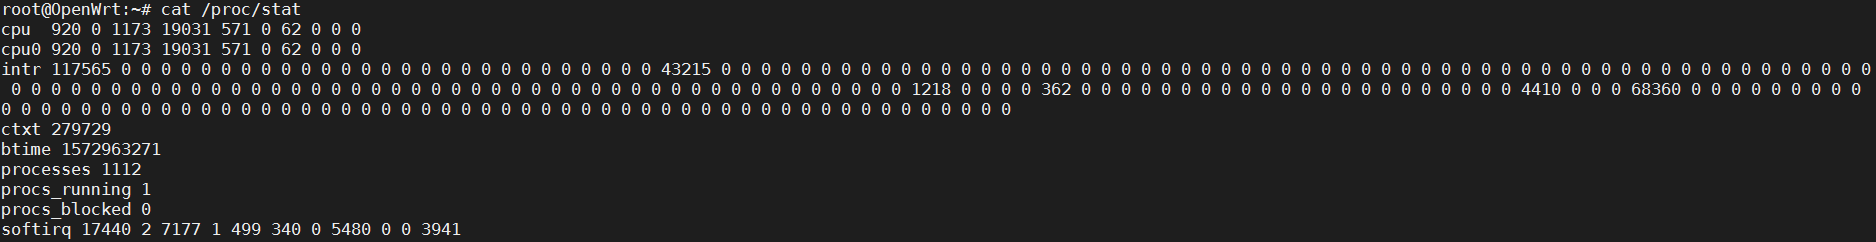
- cat /proc/stat
我们参看busybox 中src code,可以发现top,iostat, mpstat 都是使用到/proc/stat, 或者/proc/
iostat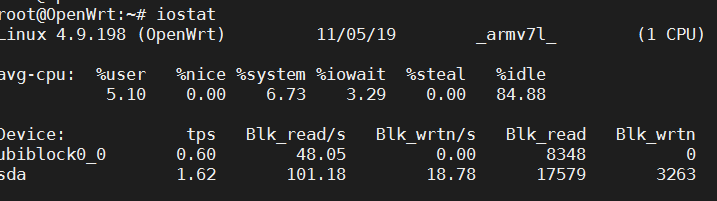
mpstat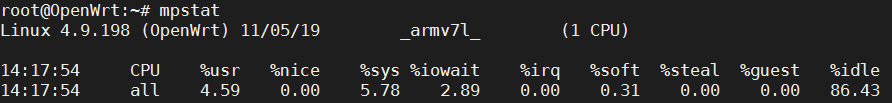
cat /proc/1/stat
1. /proc/stat
CPU time = user + nice + system + idle + iowait + irq + softirq + Steal
| item | remarks |
|---|---|
| user time | 普通用户进程占用时间 |
| nice time | 高优先级用户进程占用时间 |
| system time | OS 中运行时间 |
| idle time | CPU 空闲时间 |
| iowait time | I/O 等待时间 |
| irq time | 硬中断处理时间 |
| softirq time | 软中断处理时间 |
| steal time | 类似于guest os 切换等未统计到的时间 |
1.1. 原理
1 | /* kernel/fs/proc/stat.c, kernel-4.9.198 */ |
在show_stat() 中kcpustat_cpu(i).cpustat[CPUTIME_USER] 这个变量时一个关键全局变量。per_cpu 的用法大致是在kernel init 时拷贝CPU NUM 份变量到不同的内存空间,访问时加上CPU NUM(i) 的偏移量。
1 | struct kernel_cpustat { |
1.2. 何时更新
那kernel_cpustat 是在什么时候更新的呢?答案是在Timer 的中断函数中进行更新。
我们可以使用dump_stack()函数打印调用栈。在clockevents_config_and_register() 进行clock event 注册时有如下关系:
1 | clockevents_config_and_register() -> |
那之后timer 将会在1/HZ 时raise 中断, 则有如下调用关系起来:
1 | tick_handle_periodic()-> |
在account_system_time() 函数中会进行分类统计CPU 占用时间。1
2
3
4
5
6
7
8
9
10
11
12
13
14
15
16
17
18
19
20
21
22
23
24
25
26
27
28
29
30/* linux/kernel/sched/cputime.c, kernel-4.9.18 */
void account_process_tick(struct task_struct *p, int user_tick)
{
cputime_t cputime, scaled, steal;
struct rq *rq = this_rq();
if (vtime_accounting_cpu_enabled())
return;
if (sched_clock_irqtime) {
irqtime_account_process_tick(p, user_tick, rq, 1);
return;
}
cputime = cputime_one_jiffy;
steal = steal_account_process_time(ULONG_MAX);
if (steal >= cputime)
return;
cputime -= steal;
scaled = cputime_to_scaled(cputime);
if (user_tick)
account_user_time(p, cputime, scaled);
else if ((p != rq->idle) || (irq_count() != HARDIRQ_OFFSET))
account_system_time(p, HARDIRQ_OFFSET, cputime, scaled);
else
account_idle_time(cputime);
}
1.3. 怎么分类
接下来的问题是我们怎么知道何时是user, system, idle 等呢?
1.3.1 user or system?
ARM CPU 可以从CPSR reg 得到当前的运行态,下面函数大概也是基于此思想:1
2
3
4
5
6
7
8
9
10
11
12
13
14
15
16
17
18
19
20
21
22
23
24
25
26
27
28/*
tick_handle_periodic() ->
tick_periodic()
*/
static void tick_periodic(int cpu)
{
if (tick_do_timer_cpu == cpu) {
write_seqlock(&jiffies_lock);
/* Keep track of the next tick event */
tick_next_period = ktime_add(tick_next_period, tick_period);
do_timer(1);
write_sequnlock(&jiffies_lock);
update_wall_time();
}
update_process_times(user_mode(get_irq_regs()));
profile_tick(CPU_PROFILING);
}
(((regs)->ARM_cpsr & 0xf) == 0)
static inline struct pt_regs *get_irq_regs(void)
{
return __this_cpu_read(__irq_regs);
}
1.3.2. system, irq, softirq ?
判断idle or system
主要通过struct rq -> runqueue 运行队列上状态判断是否是IDLE。1
2
3
4
5
6
7
8
9
10
11void account_process_tick(struct task_struct *p, int user_tick)
{
struct rq *rq = this_rq();
...
if (user_tick)
account_user_time(p, cputime, scaled);
else if ((p != rq->idle) || (irq_count() != HARDIRQ_OFFSET))
account_system_time(p, HARDIRQ_OFFSET, cputime, scaled);
else
account_idle_time(cputime);
}
判断system, irq, softirq
kernel 判断通过thread_info 中preempt_count 进行判断。
在进入中断时,preempt_count 会进行设定。
1 |
|
1.4. 准确性
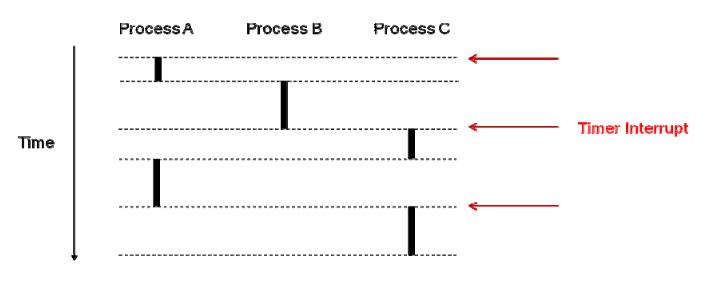
通过上面的分析,我们知道数据更新频率是1/HZ。 如果在一个timer 中断周期内有进程的调度,那么我们在timer 周期中断函数统计就可能漏掉了调度前进程占用CPU 的时间。这就最终与我们的Kernel HZ 的配置有一定的关系, 不过一般情况下kenrel 进程切换的频率并没有达到如此频繁程度。
如下图所示, 在前一个Timer 周期内,Process A, Process B 在调度,那么在中断时,我们只统计到了process B, 我们就漏了Process A 占用时间。
引起进程调度的常见原因有:
- 进程调用sleep(), exit() 等函数
- 进程时间片耗尽
- driver 中主动调用schedule()
- 从中断等异常,系统调用返回用户态
我们可以通过如下方式得到当前OS 调度程度 watch -d -n 1 'cat /proc/sched_debug | grep nr_switches'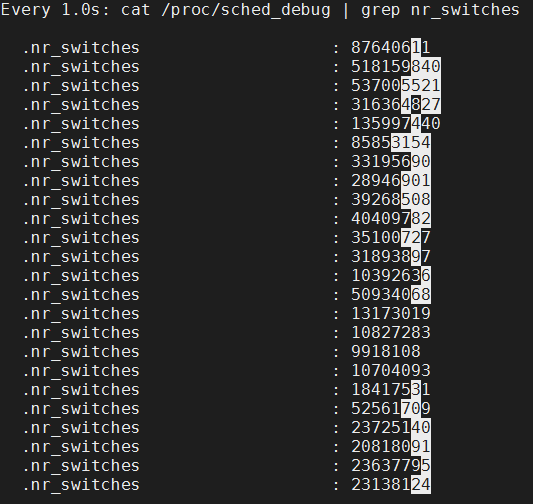
2. 总结
- Linux CPU占用率是根据/proc/stat文件中的数据计算而来;
- /proc/stat中的数据精度为ticks,即1/HZ秒;
- 内核每个ticks会更新一次CPU使用信息;
- CPU 占用率的精度为1/HZ秒, 数据信息单位是ticks