arm backtrace 的实现主要有两种方式:
- APCS (逐步被淘汰) 向gcc 传递选项
-mapcs-frameor-mapcs - unwind 向gcc 传递选项
-funwind-tables
1. APCS
APCS (ARM Procedure Call Standard) ARM过程调用标准规范了arm寄存器的使用、过程调用时 出栈和入栈的约定。每次函数调用都需要准从这一套规范,入栈规定的寄存器。
| register | alias | remarks |
|---|---|---|
| r11 | FP | frame pointer |
| r12 | IP | The Intra-Procedure-call scratch register. (可简单的认为暂存SP) |
| r13 | SP | The Stack Pointer. |
| r14 | LR | The Link Register. |
| r15 | PC | The Program Counter. |
注:thumb2 模式下有所不同,FP 为R7。
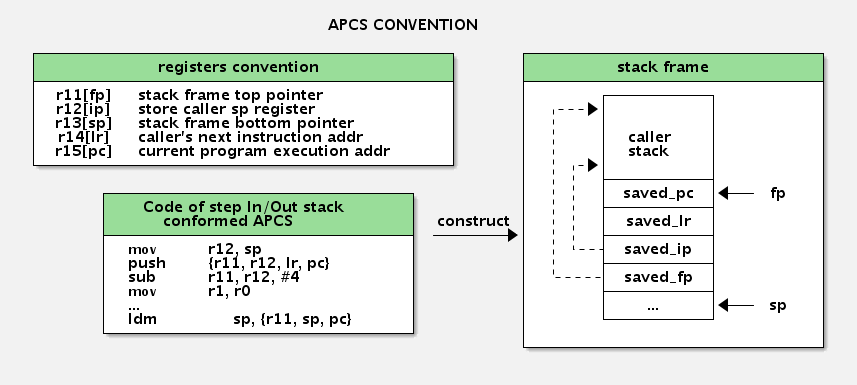
每个函数都有自己的栈空间,这一部分我们称为栈帧,在函数被调用的时候创建,在函数返回后销毁。stack frame的两个边界分别由FP和SP来限定,其中SP指向栈顶,FP指向栈基址, PC。 在被调用函数callee中Stack 保存了调用函数caller 的{FP, SP, LR, PC},通过pop 操作就可以知道caller 函数对应的寄存器值。这样递归操作就能知道整个调用栈。
2. UNWIND
相较于APCS,消耗更大的栈空间,占用更多寄存器,对性能有影响,unwind 占用额外的段,但不影响性能。在GCC > 4.5 增加新特性。它的原理是记录每个函数的 入栈指令(一般比APCS的入栈要少的多)到特殊的段.ARM.unwind_idx .ARM.unwind_tab。那他是怎么产生的呢?GCC 编译时如果有-funwind-tables 选项则会生成。
在ld 链接脚本里,有如下定义:1
2
3
4
5
6
7
8
9
10
11
12
13
14
15
16
17/*linux/arch/arm/kernel/vmlinux.lds */
/*
* Stack unwinding tables
*/
. = ALIGN(8);
.ARM.unwind_idx : {
__start_unwind_idx = .;
*(.ARM.exidx*)
__stop_unwind_idx = .;
}
.ARM.unwind_tab : {
__start_unwind_tab = .;
*(.ARM.extab*)
__stop_unwind_tab = .;
}
我们使用arm-none-linux-readelf -u vmlinux 命令读取vmlinux 中unwind 段,使用arm-none-linux-objdump -D vmlinux 命令反汇编vmlinux 中函数。
下面是截取对应某个函数分析:1
2
3
4
5/* vmlinux unwind 部分段 */
0x81244d44 <proc_sys_write>: 0x80028400
Compact model index: 0
0x02 vsp = vsp + 12
0x84 0x00 pop {r14}
0x81244d44 为函数虚拟地址。0x80028400 为编码,编码对应的函数栈操作的逆过程出栈的伪指令,这样编码的目的是为减少段空间的浪费。
它的结构类似于:1
2
3
4struct unwind_idx {
unsigned long addr_offset;
unsigned long insn;
};
1 | /* vmlnux 反汇编部分段 */ |
回溯时,根据PC 值在uwind 段中查询到函数栈操作的反向操作即出栈,进而知道上一次调用函数的地址。以此方法递归则可以知道整个函数调用栈。
With the -funwind-tables flag:1
2
3
4
5
6
7
8Idx Name Size VMA LMA File off Algn
0 .text 0005a600 08000000 08000000 00004000 2**14
CONTENTS, ALLOC, LOAD, CODE
1 .ARM.exidx 00003fd8 0805a600 0805a600 0005e600 2**2
CONTENTS, ALLOC, LOAD, READONLY, DATA
2 .ARM.extab 000049d0 0805e5d8 0805e5d8 000625d8 2**2
CONTENTS, ALLOC, LOAD, READONLY, DATA
3 .rodata 0003e380 08062fc0 08062fc0 00066fc0 2**5
No flag:1
2
3
4
5
6
7Sections:
Idx Name Size VMA LMA File off Algn
0 .text 00058b1c 08000000 08000000 00004000 2**14
CONTENTS, ALLOC, LOAD, CODE
1 .ARM.exidx 00000008 08058b1c 08058b1c 0005cb1c 2**2
CONTENTS, ALLOC, LOAD, READONLY, DATA
2 .rodata 0003e380 08058b40 08058b40 0005cb40 2**5
3. 实现
3.1. 在用户空间实现backtrace
通过下面参看链接 Getting the saved instruction pointer address from a signal handler 我们知道在用户空间实现backtrace的方法主要通过:
- sigaction 获取到ucontext
- dladdr 获取到符号表的信息
当sigaction() sa_flags == SA_SIGINFO时,sa_sigaction() handler 第三个参数为struct ucontext *,从ucontext 可以得到fp, sp, lr, pc 等寄存器值,我们再借助dladdr() 得到函数函数名。
1 |
|
实现arm architecture 的user space 用例。1
2
3
4
5
6
7
8
9
10
11
12
13
14
15
16
17
18
19
20
21
22
23
24
25
26
27
28
29
30
31
32
33
34
35
36
37
38
39
40
41
42
43
44
45
46
47
48
49
50
51
52
53
54
55
56
57
58
59
60
61
62
63
64
65
66
67
68
69
70
71
72
73
74
75
76
77
78
79
80
81
82
83
84
85
86
87
88
89
90
91
92
93
94
95
96
/* Structure containing information about object searched using
`dladdr'. */
typedef struct
{
__const char *dli_fname; /* File name of defining object. */
void *dli_fbase; /* Load address of that object. */
__const char *dli_sname; /* Name of nearest symbol. */
void *dli_saddr; /* Exact value of nearest symbol. */
} Dl_info;
extern int dladdr (__const void *__address, Dl_info *__info) __THROW __nonnull ((2));
static void print_reg(const ucontext_t *uc)
{
sigsegv_outp("reg[%02d] = 0x"REGFORMAT, 0, uc->uc_mcontext.arm_r0);
sigsegv_outp("reg[%02d] = 0x"REGFORMAT, 1, uc->uc_mcontext.arm_r1);
sigsegv_outp("reg[%02d] = 0x"REGFORMAT, 2, uc->uc_mcontext.arm_r2);
sigsegv_outp("reg[%02d] = 0x"REGFORMAT, 3, uc->uc_mcontext.arm_r3);
sigsegv_outp("reg[%02d] = 0x"REGFORMAT, 4, uc->uc_mcontext.arm_r4);
sigsegv_outp("reg[%02d] = 0x"REGFORMAT, 5, uc->uc_mcontext.arm_r5);
sigsegv_outp("reg[%02d] = 0x"REGFORMAT, 6, uc->uc_mcontext.arm_r6);
sigsegv_outp("reg[%02d] = 0x"REGFORMAT, 7, uc->uc_mcontext.arm_r7);
sigsegv_outp("reg[%02d] = 0x"REGFORMAT, 8, uc->uc_mcontext.arm_r8);
sigsegv_outp("reg[%02d] = 0x"REGFORMAT, 9, uc->uc_mcontext.arm_r9);
sigsegv_outp("reg[%02d] = 0x"REGFORMAT, 10, uc->uc_mcontext.arm_r10);
sigsegv_outp("FP = 0x"REGFORMAT, uc->uc_mcontext.arm_fp);
sigsegv_outp("IP = 0x"REGFORMAT, uc->uc_mcontext.arm_ip);
sigsegv_outp("SP = 0x"REGFORMAT, uc->uc_mcontext.arm_sp);
sigsegv_outp("LR = 0x"REGFORMAT, uc->uc_mcontext.arm_lr);
sigsegv_outp("PC = 0x"REGFORMAT, uc->uc_mcontext.arm_pc);
sigsegv_outp("CPSR = 0x"REGFORMAT, uc->uc_mcontext.arm_cpsr);
sigsegv_outp("Fault Address = 0x"REGFORMAT, uc->uc_mcontext.fault_address);
sigsegv_outp("Trap no = 0x"REGFORMAT, uc->uc_mcontext.trap_no);
sigsegv_outp("Err Code = 0x"REGFORMAT, uc->uc_mcontext.error_code);
sigsegv_outp("Old Mask = 0x"REGFORMAT, uc->uc_mcontext.oldmask);
}
static void print_call_link(const ucontext_t *uc)
{
int i = 0;
Dl_info dl_info;
const void **frame_pointer = (const void **)uc->uc_mcontext.arm_fp;
const void *return_address = (const void *)uc->uc_mcontext.arm_pc;
sigsegv_outp("\nStack trace:");
while (return_address) {
memset(&dl_info, 0, sizeof(Dl_info));
if (!dladdr((void *)return_address, &dl_info)) break;
const char *sname = dl_info.dli_sname;
sigsegv_outp("%02d: %p <%s + %lu> (%s)", ++i, return_address, sname,
(unsigned long)return_address - (unsigned long)dl_info.dli_saddr,
dl_info.dli_fname);
if (dl_info.dli_sname && !strcmp(dl_info.dli_sname, "main")) break;
if (!frame_pointer) break;
return_address = frame_pointer[-1];
frame_pointer = (const void **)frame_pointer[-3];
}
sigsegv_outp("Stack trace end.");
}
static void segv_handler(int signal_number, siginfo_t *info, void *context)
{
sigsegv_outp("Segmentation Fault!");
sigsegv_outp("info.si_signo = %d", signal_number);
if (info) {
sigsegv_outp("info.si_errno = %d", info->si_errno);
sigsegv_outp("info.si_code = %d (%s)", info->si_code,
(info->si_code == SEGV_MAPERR) ? "SEGV_MAPERR" : "SEGV_ACCERR");
sigsegv_outp("info.si_addr = %p\n", info->si_addr);
}
if (context) {
const ucontext_t *uc = (const ucontext_t *)context;
print_reg(uc);
print_call_link(uc);
}
_exit(0);
}
void setup_sigsegv(void)
{
struct sigaction sa;
memset(&sa, 0, sizeof(sa));
sa.sa_sigaction = segv_handler;
sa.sa_flags = SA_SIGINFO;
sigaction(SIGSEGV, &sa, NULL);
}
3.2. kernel space 的backtrace
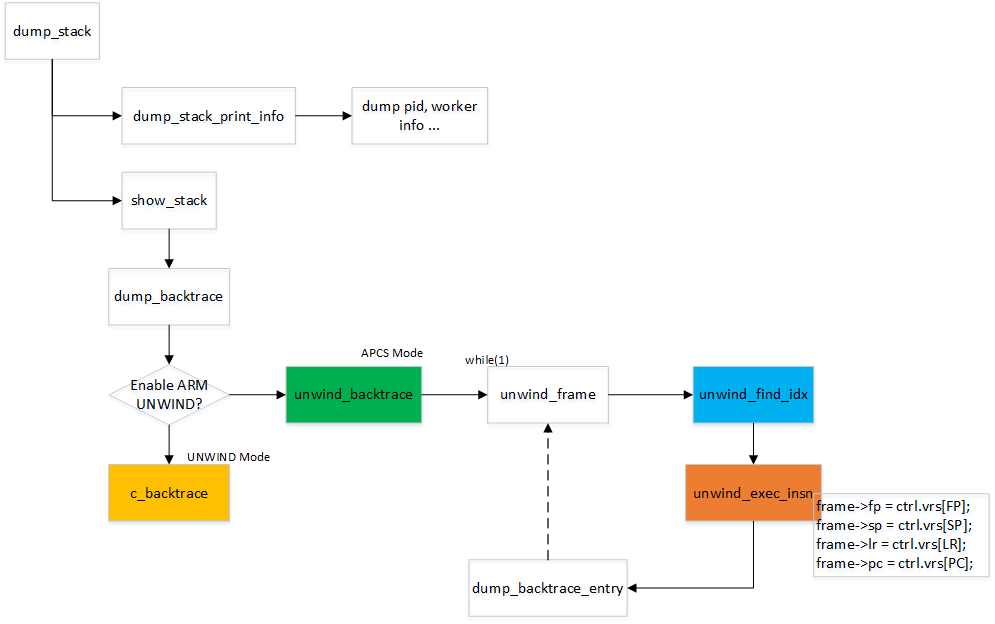
在内核中dump_stack() 函数对应于不同的arch 实现了backtrace 的功能。下面我们来简单分析一下。
1 | /* linux-4.9.198, linux/lib/dump_stack.c */ |
dump_stack_print_info() 主要dump 当前进程pid,name 等。我们主要分析show_stack()
整体flow 参见下面调用图:
1 | /* linux/arch/arm/kernel/traps.c */ |
ok, 我们接下来分析unwind_backtrace(), 在该函数中借助于gcc 的build_in 参数得到FP, LR 等,PC 就设定为当前unwind_backtrace()。得到我们想要的struct stackframe frame 数据后,在while (1) 中进行回溯打印整个调用栈。
builtin_frame_address(0), builtin_return_address(0)等为gcc 内建函数。可以参看如下文章:
gcc 内建函数
builtin_frame_address, builtin_return_address
Getting the Return or Frame Address of a Function
1 | register unsigned long current_stack_pointer asm ("sp"); |
unwind_frame() 主要的作用是利用unwind_find_idx() 函数在.ARM.unwind_idx 段中找到当前PC 对应的idx。借此也找到了.ARM.unwind_tab 对应的出栈操作,并用unwind_exec_insn()函数进行出栈操作, 出栈完成后,FP, SP, LR, PC 寄存器已经更新,在最后更新struct stackframe frame 以便下一次的递归回溯。
1 | int unwind_frame(struct stackframe *frame) |
Reference
在用户空间实现backtrace
Getting the saved instruction pointer address from a signal handler
How to get fullstacktrace using _Unwind_Backtrace on SIGSEGV
kernel dump_stack分析
ARM 架构 dump_stack 实现分析(2.0 调用时序)
内核性能调试–ftrace
linux内核中打印栈回溯信息 - dump_stack()函数分析
内核符号表的生成和查找过程